Farm investment returns explained: gross yield, deductions and what actually lands in your account
4 September 2026 6 min read
Return percentages mean nothing until you know what they are calculated on. This is how a FarmInvest project return is built up, using round numbers so you can follow the arithmetic on any project you are shown.
Start with the crop budget, not the promise
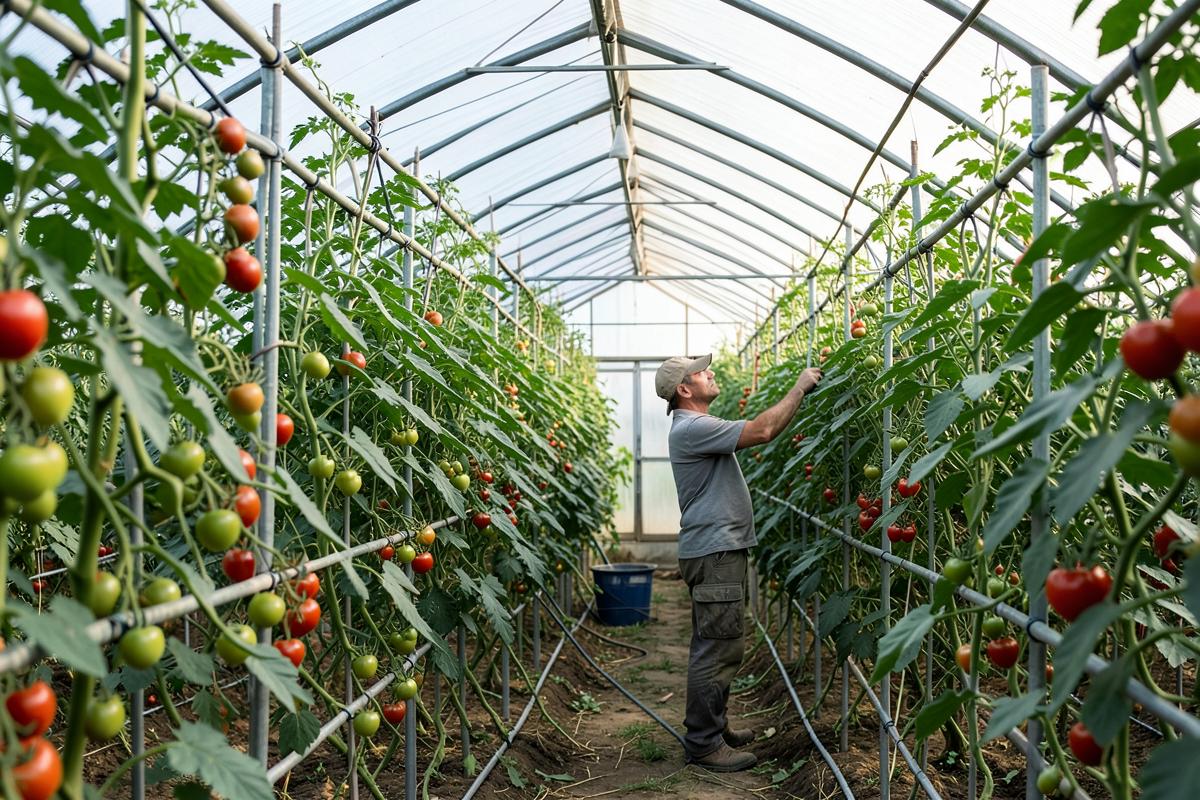
Take a one-hectare tunnel tomato cycle. Suppose the budget is R220 000 for seedlings, fertiliser, chemicals, labour and packaging, and the expected sales are R520 000 across a twelve-week picking window at an average market price. Gross margin before overheads is R300 000.
Then subtract the deductions that are agreed up front
Overheads, transport to market, market commission, management fee and any equipment hire come off before profit is shared. In this example, say those total R90 000. The distributable profit is R210 000.
- Market commission and transport are real and unavoidable — treat any budget without them as incomplete
- Management fees should be stated as a number or a fixed percentage, never 'to be determined'
- Deductions on FarmInvest are visible in your statement, with the reason for each one
Your share, on your capital, over the cycle length
If you funded R220 000 of the working capital and the agreed split gives you 60% of distributable profit, your share is R126 000 — about 57% on capital over roughly six months. Annualising that number is where most marketing goes wrong: you cannot plant tunnels back to back forever, and one bad price week changes it materially. We publish an expected range for the cycle, not an annualised headline.
What makes the number move
Yield per hectare, average selling price, rejection rate at grading and the length of the picking window. Those four numbers explain almost all of the difference between a good and a poor cycle, which is why they are the numbers reported to you while the crop is growing.
Reinvestment is where compounding happens
Most investors on the platform roll their capital plus part of their profit into the next cycle. The five-year projection tool in the investor portal shows what that looks like at conservative, expected and strong price assumptions — including the years where a cycle underperforms.
Ready for the next step?
Farming and investing both go better with clear numbers. Start where it suits you.